
Post last updated: July 31, 2022
An new diagram of Power BI Datamarts is now available. It includes the technical components of a Power BI datamart.
Want to download a copy? Head on over to the Diagrams page where the latest version will always be. You can download a PDF copy of it from the Diagrams page.
This blog post includes a brief summary of each technical component of a Power BI datamart. Datamarts are really new, and they’ll be changing as (1) the functionality matures over time, and (2) based on feedback that customers give. Therefore, I’ve kept the descriptions below brief.
This post is introductory from the perspective that we’re introducing what the “puzzle pieces” are for a datamart collectively. It’s also somewhat intermediate/advanced because this post assumes you have previous knowledge of what each of the individual components are (like datasets and dataflows). Also, I’m not elaborating on use cases for a datamart in this post since that’s a very big conversation all on its own.
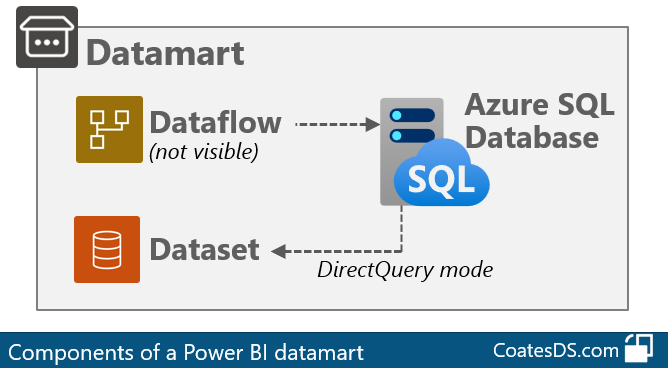
I put the following diagram together to help understand the technical components of a datamart:
Datamarts are a new type of artifact in the Power BI service. I think of the datamart as primarily a data management layer for doing data preparation and data modeling.
Datamarts are best suited to departmental-level solutions, with fairly straightforward needs. They’re targeted at self-service BI authors and owners who want to create and manage their data, and who want to use a SQL database.

One thing that I really (really, really) like about datamarts is that they inherently encourage creators to manage their data separate from their reports. I’m a big proponent of reusing existing data whenever it makes sense to do so.
The rest of this post is a short roundup of the technical components shown in the above diagram.
Power BI Service
The Power BI service is shown in the light yellow box on the diagram above.
A datamart is created and managed in the Power BI service using a web browser. A web-based experience works well for organizations with a lot of Mac and non-PC users who can't run Power BI Desktop. Or, for orgs with strict IT policies for when updates for Power BI Desktop get installed (and end up being very far behind).
The web-based experience includes data preparation and the data management: including web modeling, relationships, measures, data refresh, and row-level security.
Keep in mind that datamarts are a young feature. They launched to public preview in June 2022. There isn't yet feature parity between Desktop and the service. That'll take time. The release plan shows web-based dataset authoring so it seems clear that expanding web-based authoring experiences are a priority for the Power BI product team.
Premium Workspace
On the diagram, the workspace is shown as a white box within the Power BI service.
A datamart is created in a workspace that's assigned to either Premium Per Capacity (PPC) or Premium Per User (PPU).
You can’t create a datamart in a Pro workspace. You also can’t create them in a personal workspace (which I’m happy about because we wouldn’t want important data being shared out of my workspace).
Datamart
On the diagram, the items shown in the grey box are the datamart components. They’re managed as a logical unit.
The general term of datamart has been around for many years now. In my experience it's usually been used to represent a subset of a larger data warehouse. For Power BI, the term datamart (spelled as one word!) is a technical representation of:
A dataflow in the Power BI service
A dataset in the Power BI service
An Azure SQL Database
Web-based functionality to design, manage and secure the datamart
Think of the datamart as the parent artifact. The dataflow and the dataset are sub-artifacts.
Dataflow
On the larger diagram at the top of this post, the dataflow is included in the grey box, and it’s connected to Power Query Online.
The datamart automatically generates a dataflow. That dataflow isn't directly visible as an artifact in the workspace, but it's there. Power Query Online is used within the datamart editor experience.
Consider the (hidden) dataflow to be your data preparation steps. Just like you'd do in the query editor within Power BI Desktop -- but in the web-based editor instead.
Management of this dataflow is coupled with management of the dataset and the database. The refresh is also managed as a collective unit.
Dataset
On the larger diagram at the top, the dataset is also included in the grey box.
The dataset a built-in artifact that gets automatically generated. Consider the dataset to be your semantic layer - it should be ‘friendly’ for analytical purposes.
The dataset stays in sync with its 'companion' relational database. This is true for:
Metadata (the schema: tables and columns)
Data (when the data is refreshed)
Row-level security (who can access what portions of the data)
The dataset is in DirectQuery mode, and it uses the relational database (the Azure SQL DB) as its source (i.e., the one that’s managed collectively as a unit). When a data refresh is scheduled, it refreshes the Azure SQL DB. Due to DirectQuery mode on the dataset, it doesn’t need a separate refresh scheduled.
The fact that the datamart keeps both the relational layer and the semantic layer in sync is going to be very appealing to a lot of people who just want to keep things simple. Need to add a new column? Update and deploy it once. Need to adjust row-level security and have it apply everywhere? Update and deploy it once.
To me, the big benefit of datamarts is about making the data management side of things easier. Although you can do some ad hoc queries, the visualization layer isn't the main point. Jointly being able to manage the database and the semantic layer is pretty cool. Having an enterprise data warehousing background myself, I can certainly see the need for ‘decoupling’ the data layers...I want that too!
But there are a lot of people who will appreciate the simplicity and the convenience. Particularly people who can’t or don’t want to create a full-fledged database separately. That’s one reason why datamarts are primarily targeted at self-service BI creators.
Database
On the larger diagram at the top, the database is also included within the grey box. The grey box extends outside of the Power BI service since it’s an Azure SQL Database. (Yeah, yeah, I know that Power BI as a whole is hosted in Azure - but how about if we skip that and stick with the conceptual level.)
The relational database really is the big new thing when it comes to datamarts. As I mentioned earlier, changes for metadata, data, and row-level security are auto-synchronized with the dataset.
The datamart loads data to a 'storage' schema that is not visible to us if we connect to the database. This is software-as-a-service (SaaS) after all, meaning that the goals are to auto-manage and reduce complexity for the user when possible.
The datamart creates database views in the 'model' schema. Those (read-only) views are exposed to us for querying the data.
What we can do with the database:
Execute ‘Select’ queries on the database views
Query some of the system views
What we can’t do with the database:
No direct table access
No DDL (Data Definition Language) – ex: Create or Alter
No DML (Data Manipulation Language) – ex: Update or Delete
Behind the scenes it’s a general purpose elastic pool Azure SQL Database. We say that it's a fully managed database because of how things are managed collectively via the datamarts interface in the Power BI service. However, it's **NOT** a "managed instance" (which is a different type of Azure SQL DB).
Querying the Datamart
The connectivity for querying the datamart is shown on the right-hand side of the larger diagram at the top of the page.
You’ll need to always be cognizant if you intend to query the database or the dataset. Measures are only created in the dataset. Relationships are also a dataset (data model) concept. Most of the time you’ll want end users and consumers to query the dataset (the semantic layer) rather than the database (the relational layer).
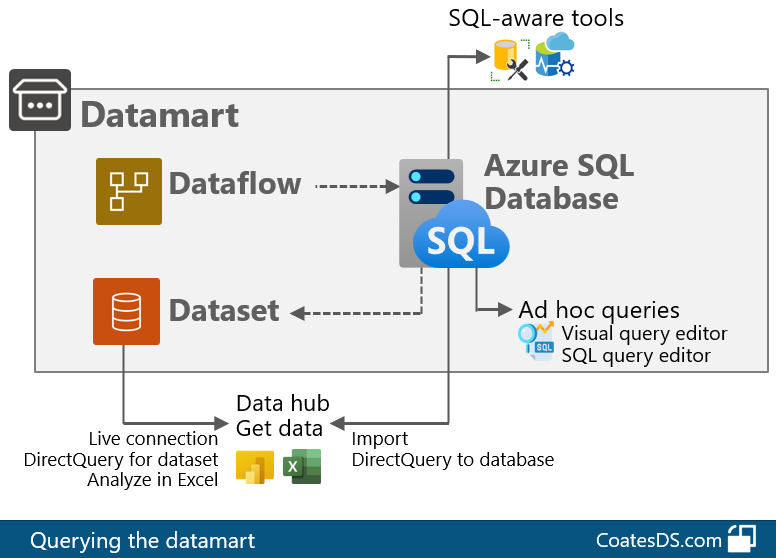
The following “zoomed in” diagram shows a little more detail of the querying options.
Power BI Desktop
From Power BI Desktop, you can query the datamart one of two ways:
Connecting to the built-in dataset
Connecting to the SQL endpoint
Datamarts that you have access to can be accessed in the Data Hub menu in Power BI Desktop (or in the Get Data menu).
When you connect to the built-in dataset from Power BI Desktop, you do this using a live connection. In this way, it functions just like any other shared dataset that you want to reuse across a variety of different reports.
When you connect to the SQL endpoint, you are making a read-only connection to the Azure SQL Database. In this situation, you are querying the underlying tables and rows. Remember - you won’t see measures when you connect to the SQL endpoint, because they only exist in the dataset (i.e., in the semantic layer).
Row-level security (RLS) is imposed the same way regardless of which way you choose to connect to the data - seriously, this is a big deal. I talk about it a bit more later in this post.
Ad Hoc Queries
Inside the datamart designer, in the browser, you can run ad hoc queries on the database two ways:
Visual query editor
SQL query editor
Both of these options, available in the web browser, query the Azure SQL DB (rather than the dataset).
The visual query editor lets you drag and drop to build out your results, whereas the SQL query editor lets your write a SQL query if you prefer that instead.
The whole idea here is to allow flexibility for different people based on their preference. Some analysts have tons of SQL query experience, whereas others don’t. If you don’t care about a SQL database experience, then you’re probably not that interested in datamarts.
SQL-Aware Tools
You can query the database using the SQL endpoint from tools like SQL Server Management Studio and Azure Data Studio.
Not all tools are supported to connect and query the Azure SQL Database.
The database is fully managed. It’s read-only and you must use the datamarts user interface in the Power BI service for all changes that edit or modify the datamart structure or data. Lots and lots of customers are talking about wanting the ability to manage the database directly, so we’ll have to see how things evolve based on customer feedback.
Excel
You can also connect to the dataset from tools like Excel (use Analyze in Excel which is conceptually similar to a live connection - i.e., we aren’t exporting the data or saving additional copies - we’re connecting to the dataset live).
Customizing the Built-In Dataset
On the larger diagram above, within the workspace (the white box) there’s a report connected directly to the dataset. There’s also a composite model connected directly to the dataset.
Using a composite model is how you’d go about extending and customizing the built-in dataset that was auto-generated by the datamart designer.
The following “zoomed in” diagram shows a little more detail of how that might work with departmental data sources and departmental reports.

A composite model means that there’s another downstream dataset that has more than one connection type. One connection is a live connection to our dataset (the one that was auto-generated by the datamart). The other connection could be (for example) imported from a different database, or a file. This all works because the composite model has a local model after converting a live connection has been convert to DirectQuery for a Power BI dataset.
Note: There are some great advantages of composite models. There are also some things to be aware of before you dive in with both feet. In my presentation called “Increasing Trustworthiness of Power BI Content” I talk about a few such considerations. There are tons of resources online for learning about composite models, and models that operate in DirectQuery mode for a Power BI dataset.
Row-Level Security
The row-level security (RLS) isn’t prominent on the larger diagram at the top. However, it’s really important that it’s worth mentioning.
The following “zoomed in” diagram shows a little more detail about RLS.
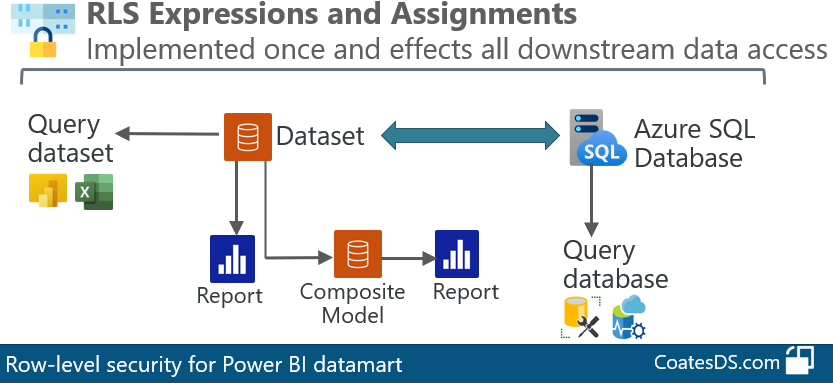
RLS is defined inside of the datamart design experience in the Power BI service. The ‘Create’ and ‘Assign’ are done side-by-side in the same place - this is different than the current RLS design experience where part is in Desktop and part is in the service.
Here’s the cool part. The RLS rules are translated into security rules in the Azure SQL Database. Meaning that…the same RLS is enforced regardless if your users are querying the dataset or the datamart.
Note: All other permissions management aspects are absolutely, positively, still valid: workspace roles, app permissions, individual item sharing.
Keep in mind there are quite a few limitations with what’s allowed for RLS as it relates to datamarts (static RLS only; no dynamic expressions). So be sure to check the documentation and test it out thoroughly. Things will be changing as datamarts evolve and mature over time.
Finding More Information
There’s a ton of helpful info available online. Here are a few of my favorite resources to find more background information on datamarts.
James Serra’s blog: Power BI Datamarts
James Serra’s blog: Power BI as an Enterprise Data Warehouse Solution?
Matthew Roche’s blog: Datamarts are Like Dataflows with Benefits
Andrew Brust’s article: Power BI Gets Low-Code Datamart Feature
Like this Content?
If you are responsible for overseeing and managing Power BI, you might enjoy our Power BI Deployment & Governance training course. We’re able to cover topics like what we discussed above more thoroughly. You’re able to jump on a group Q&A call with us every other week - We even had a Q&A call devoted to discussing Power BI datamarts specifically. We also have live workshops every month to work through something specific together. We invite you to check it out.
